Phonon workflow#
This is the phonon workflow that is based on the finite displacement approach as implemented in Phonopy.
If you want to read more about Phonopy, please read Togo’s paper: https://doi.org/10.7566/JPSJ.92.012001
Let’s install atomate2 first:
 %%capture
 !pip install atomate2[strict]
Let’s start with the workflow#
We now simply load the force field phonon workflow. It uses CHGNet as a universal ML potential by default.
from atomate2.forcefields.flows.phonons import PhononMaker
from pymatgen.core.structure import Structure

struct = Structure(
        lattice=[[0, 2.73, 2.73], [2.73, 0, 2.73], [2.73, 2.73, 0]],
        species=["Si", "Si"],
        coords=[[0, 0, 0], [0.25, 0.25, 0.25]],
    )
phonon_flow = PhononMaker(min_length=15.0, store_force_constants=False).make(structure=struct)
/home/jgeorge/miniconda3/envs/pythonProject1/lib/python3.11/site-packages/tqdm/auto.py:21: TqdmWarning: IProgress not found. Please update jupyter and ipywidgets. See https://ipywidgets.readthedocs.io/en/stable/user_install.html
  from .autonotebook import tqdm as notebook_tqdm
Let’s have a look at the computing jobs#
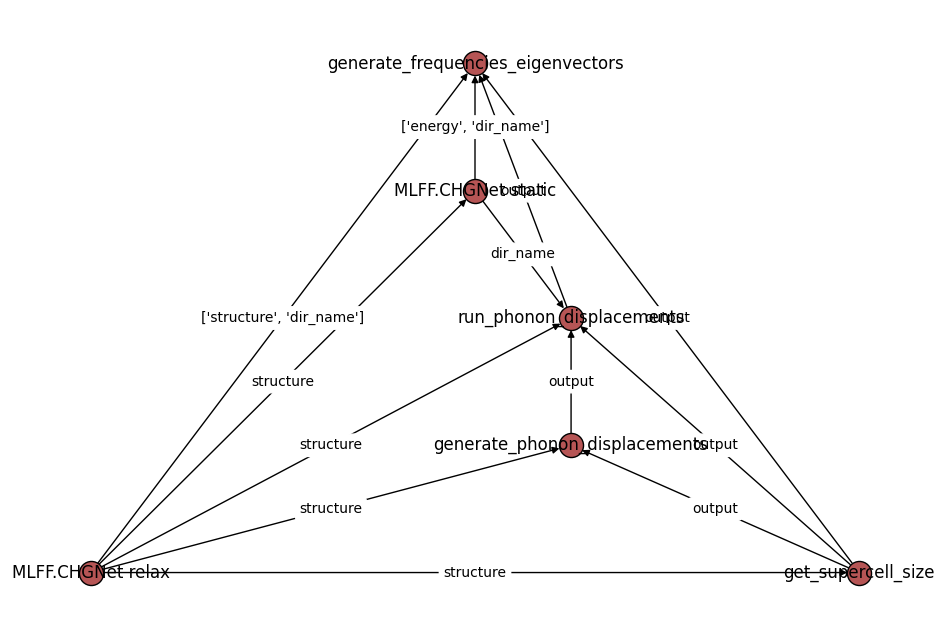
The phonon run will first perform a bulk relaxation, then the displacements are generated and run. As we currently don’t have a way to compute BORN charges with such potentials, a non-analytical term correction is not performed here.
phonon_flow.draw_graph().show()
Let’s execute the workflow#
%%capture
from jobflow import run_locally

run_locally(phonon_flow, create_folders=True)
Let’s have a look at the outputs#
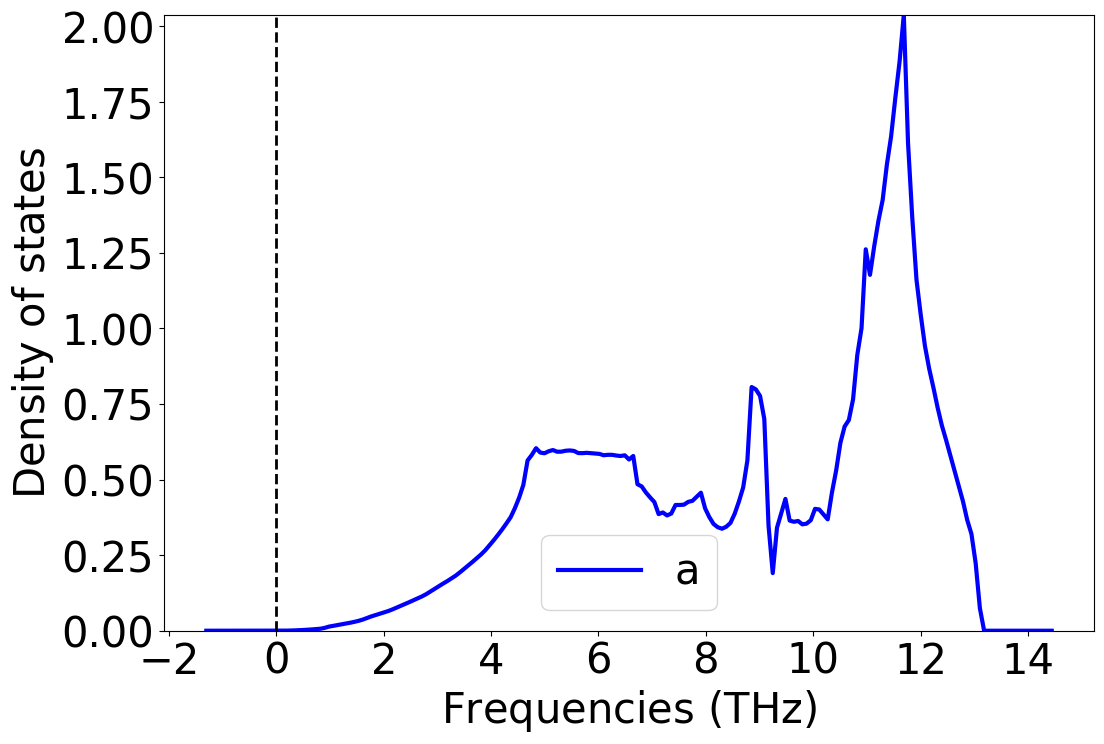
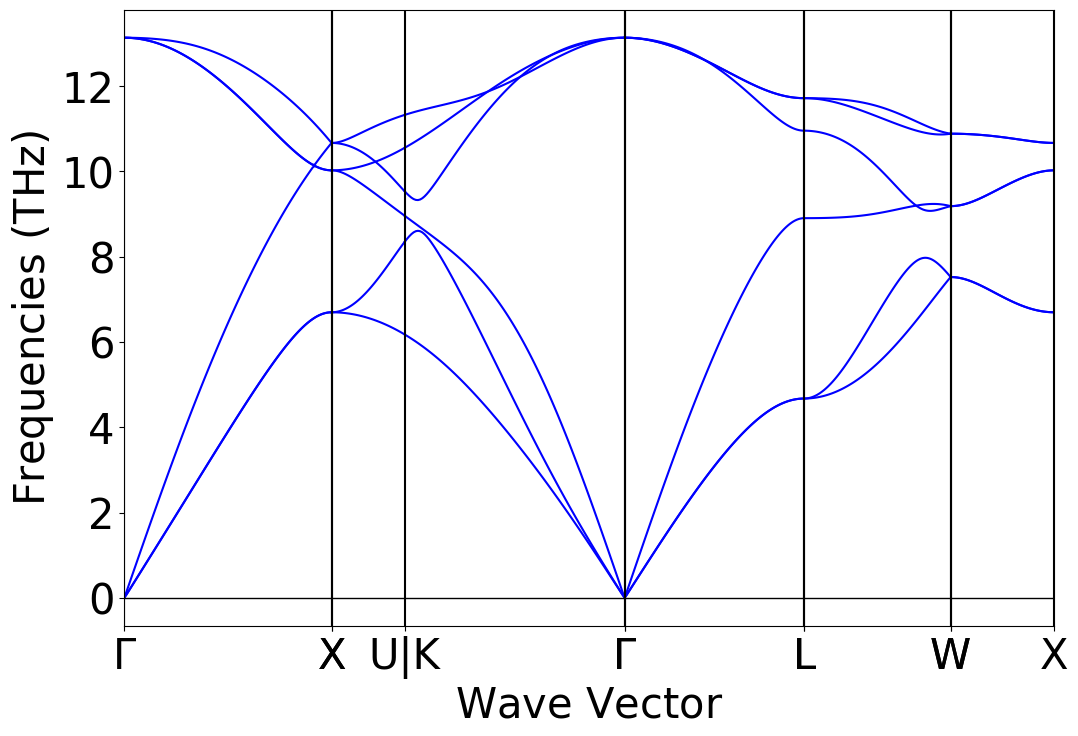
We query our database for the relevant outputs (here DOS and band structure)
from pymatgen.phonon.bandstructure import PhononBandStructureSymmLine
from pymatgen.phonon.dos import PhononDos
from pymatgen.phonon.plotter import PhononBSPlotter, PhononDosPlotter
from jobflow import SETTINGS

store = SETTINGS.JOB_STORE
store.connect()

result = store.query_one(
    {"name": "generate_frequencies_eigenvectors"},
    properties=[
        "output.phonon_dos",
        "output.phonon_bandstructure",
    ],
    load=True,
    sort={"completed_at": -1} # to get the latest computation
)
We can then easily plot the results:
ph_bs = PhononBandStructureSymmLine.from_dict(result['output']['phonon_bandstructure']) # get pymatgen bandstructure object
ph_dos = PhononDos.from_dict(result['output']['phonon_dos']) # get pymatgen phonon dos object

# initialize dos plotter and visualize dos plot
dos_plot = PhononDosPlotter()
dos_plot.add_dos(label='a', dos=ph_dos)
dos_plot.get_plot()

# initialize Phonon bandstructure plotter and visualize band structure plot
bs_plot = PhononBSPlotter(bs=ph_bs)
bs_plot.get_plot()
<Axes: xlabel='$\\mathrm{Wave\\ Vector}$', ylabel='$\\mathrm{Frequencies\\ (THz)}$'>
Change the force field#
Are you now interested in how M3GNet performs?
from jobflow import SETTINGS
from jobflow import run_locally
from pymatgen.core.structure import Structure

from atomate2.forcefields.flows.phonons import PhononMaker
from atomate2.forcefields.jobs import M3GNetRelaxMaker, M3GNetStaticMaker

from pymatgen.phonon.bandstructure import PhononBandStructureSymmLine
from pymatgen.phonon.dos import PhononDos
from pymatgen.phonon.plotter import PhononBSPlotter, PhononDosPlotter

struct = Structure(
    lattice=[[0, 2.73, 2.73], [2.73, 0, 2.73], [2.73, 2.73, 0]],
    species=["Si", "Si"],
    coords=[[0, 0, 0], [0.25, 0.25, 0.25]],
)
phonon_flow = PhononMaker(min_length=15.0, store_force_constants=False,
                          bulk_relax_maker=M3GNetRelaxMaker(relax_kwargs={"fmax": 0.00001}),
                          phonon_displacement_maker=M3GNetStaticMaker(),
                          static_energy_maker=None).make(structure=struct)
%%capture
run_locally(phonon_flow, create_folders=True, store=SETTINGS.JOB_STORE)
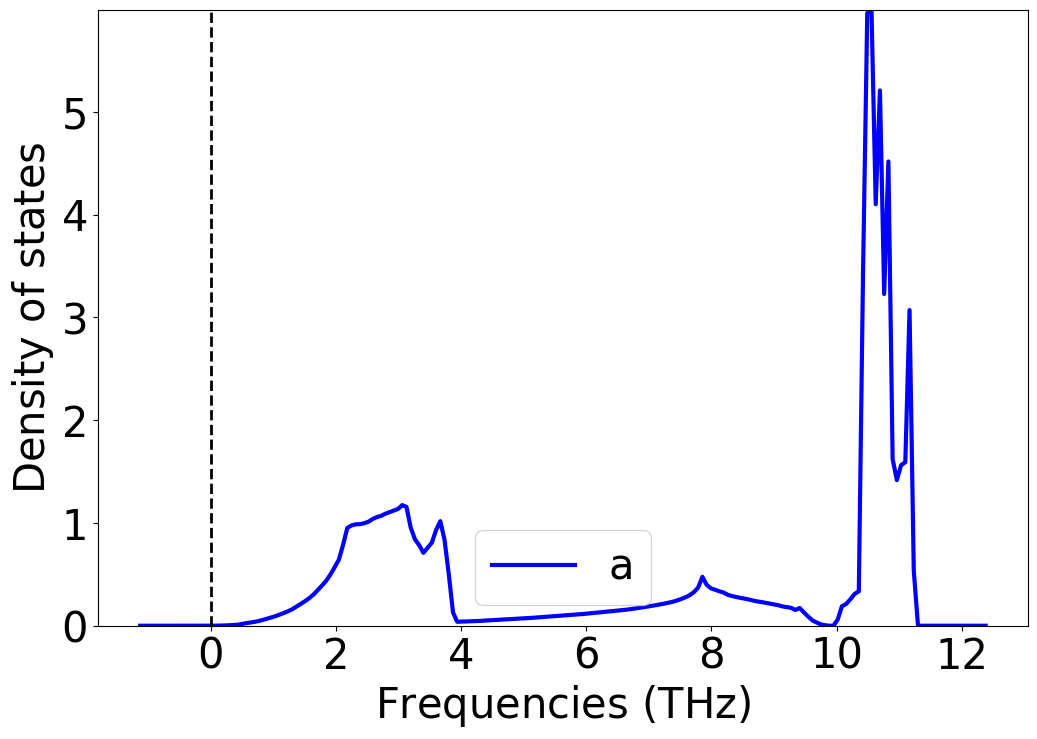
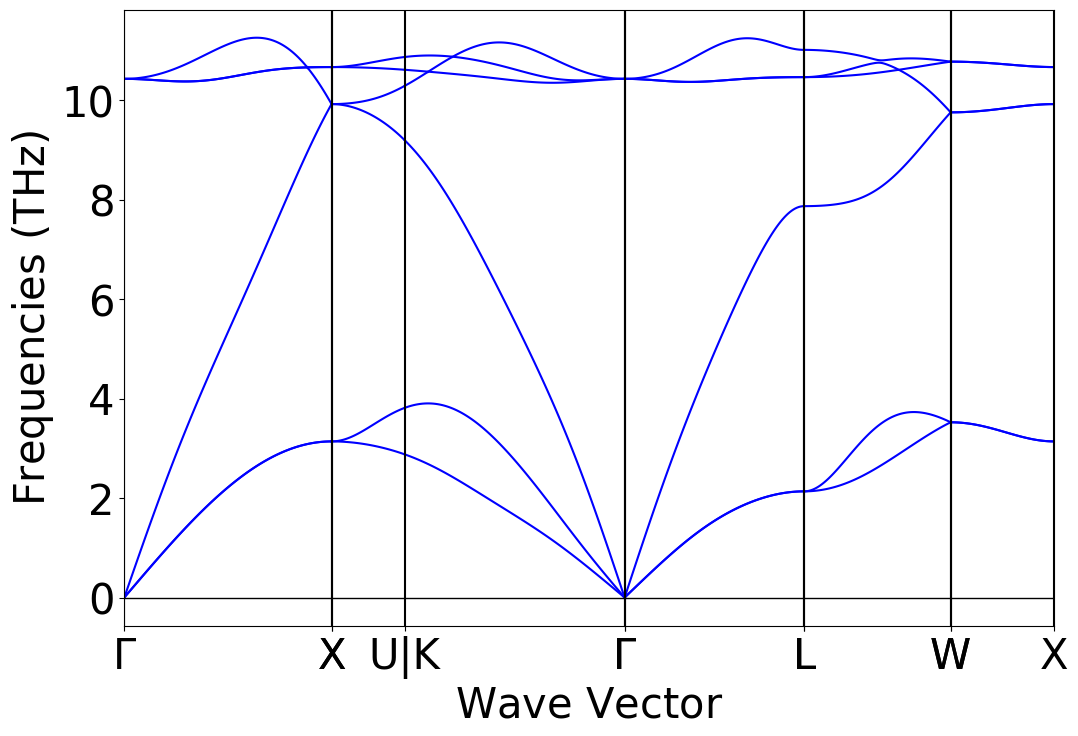
We can again visualize the results:
store = SETTINGS.JOB_STORE
store.connect()

result = store.query_one(
    {"name": "generate_frequencies_eigenvectors"},
    properties=[
        "output.phonon_dos",
        "output.phonon_bandstructure",
    ],
    load=True,
    sort={"completed_at": -1} # to get the latest computation
)

ph_bs = PhononBandStructureSymmLine.from_dict(
    result['output']['phonon_bandstructure'])  # get pymatgen bandstructure object
ph_dos = PhononDos.from_dict(result['output']['phonon_dos'])  # get pymatgen phonon dos object

# initialize dos plotter and visualize dos plot
dos_plot = PhononDosPlotter()
dos_plot.add_dos(label='a', dos=ph_dos)
dos_plot.get_plot()

# initialize Phonon bandstructure plotter and visualize band structure plot
bs_plot = PhononBSPlotter(bs=ph_bs)
bs_plot.get_plot()
<Axes: xlabel='$\\mathrm{Wave\\ Vector}$', ylabel='$\\mathrm{Frequencies\\ (THz)}$'>
Note on levels of theory#
While the results for Si look very promising, you might need to carefully check for other materials.
We also have GAP interface, that you might want to try.
DFT?#
The same workflow can also be executed with DFT. Currently, a VASP interface exits. More interfaces are under development.
